Website Stats For Face by Holly
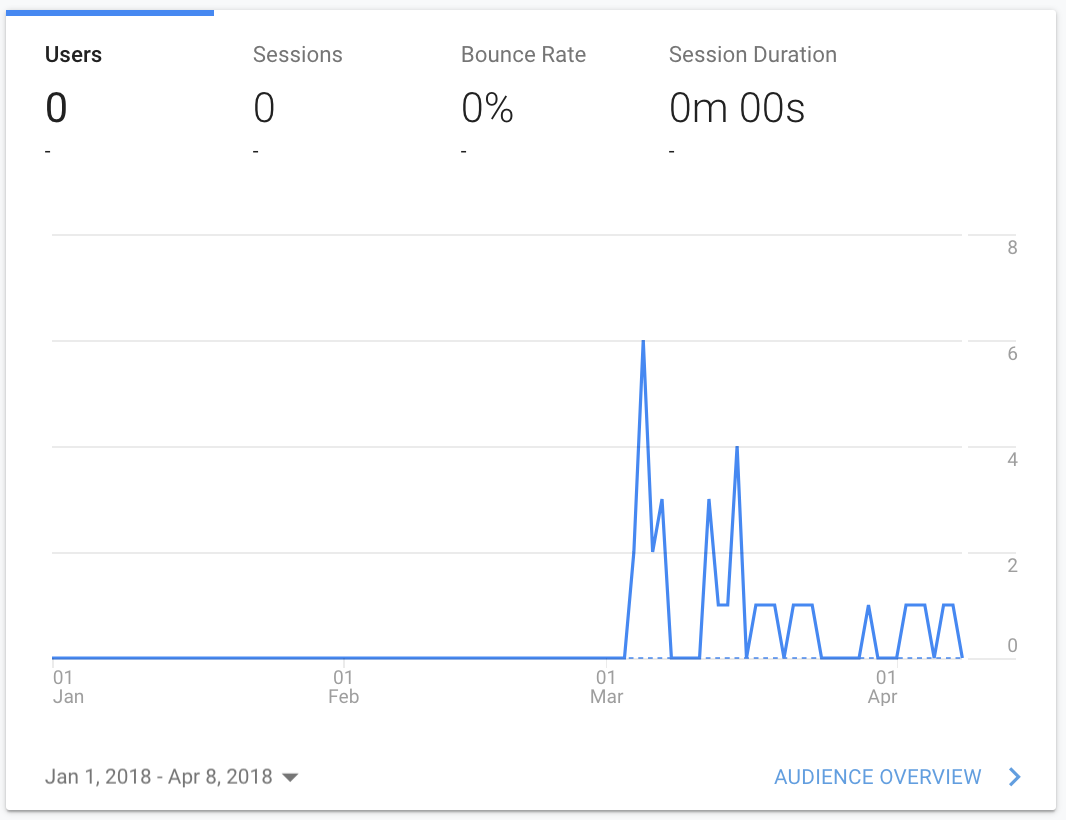
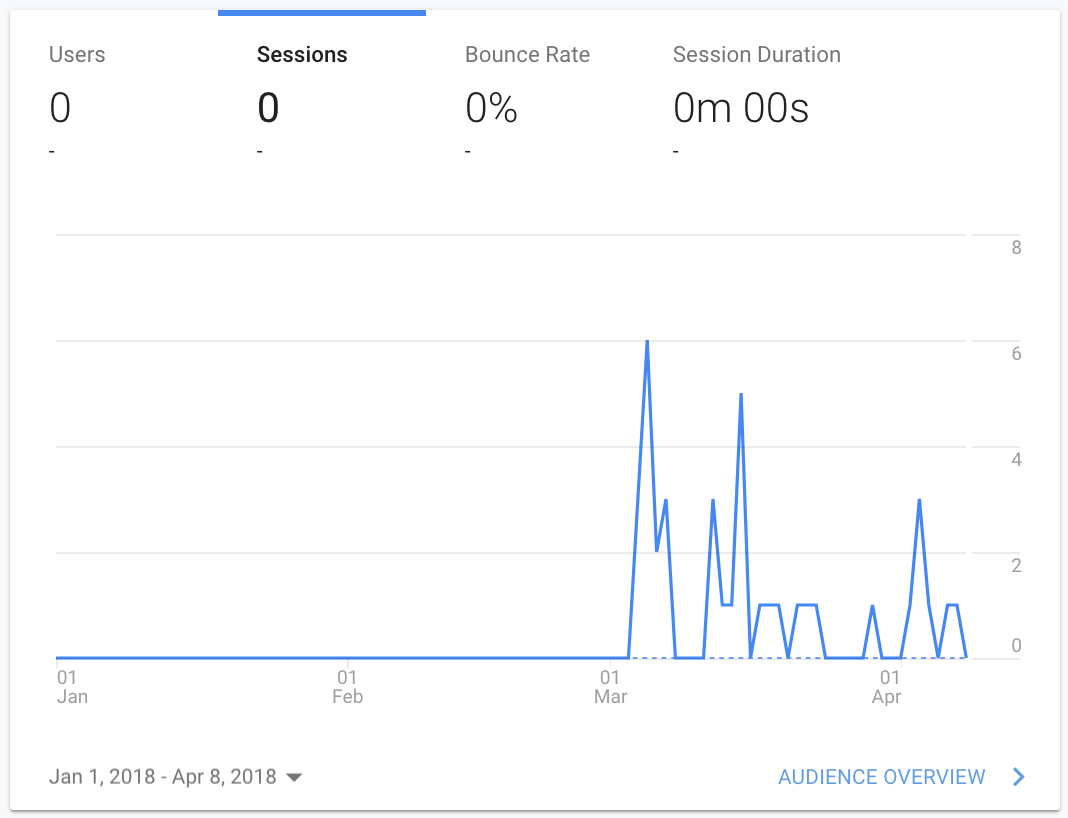
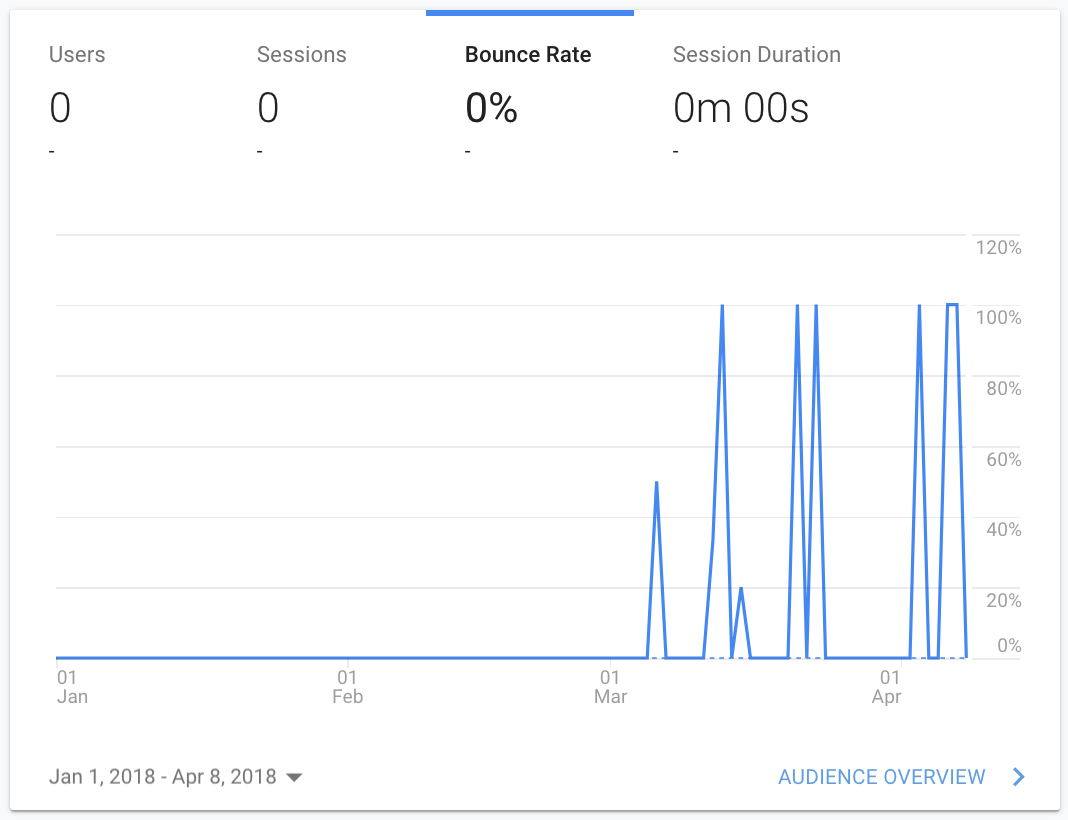
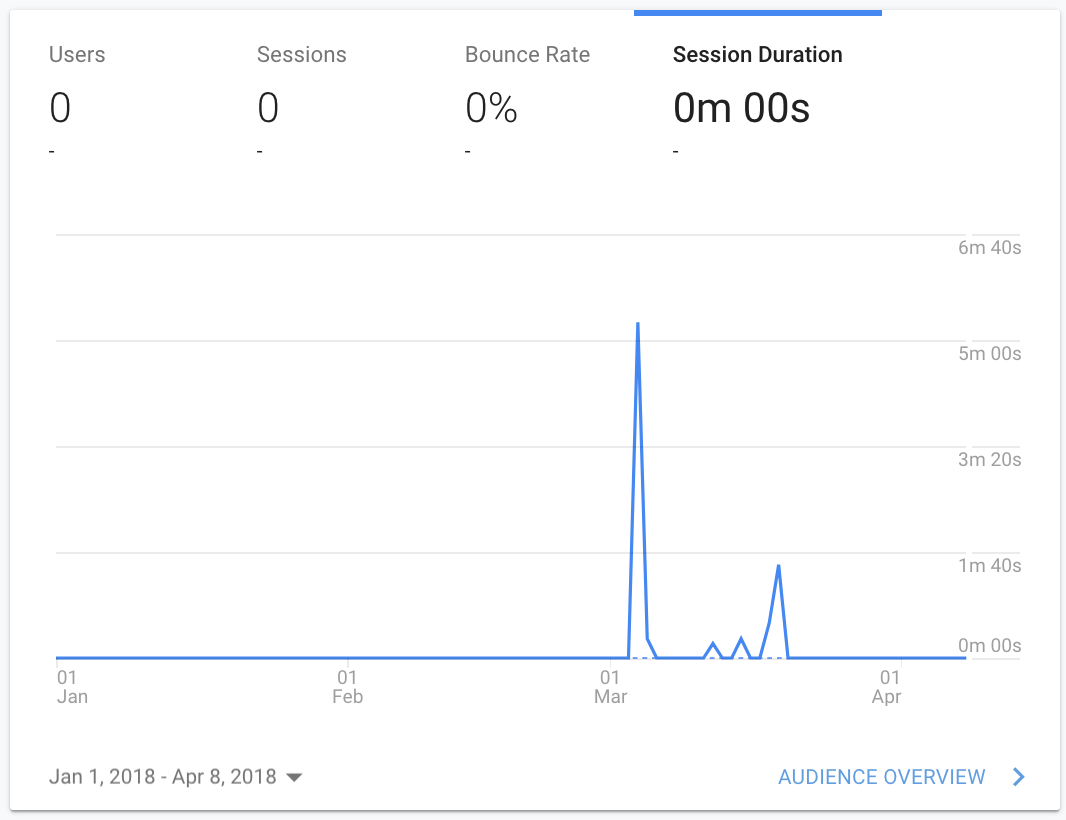
We changed the plan for the website to not necessarily promote it throughout the campaign but mainly use it to see where the traffic comes from and if the traffic rises over the course of the 6 weeks. Google Analytics tells us 100% of our traffic comes through “referring traffic” meaning from links on other sites. Rather than direct traffic from typing in the URL or clicking a bookmark. Or search traffic from people finding the site through Google.
We struggled to differentiate which specific account brought what traffic in but Instagram’s insights suggests around 40 people followed the link in our bio. From that we can conclude Instagram bought the most views to the website.
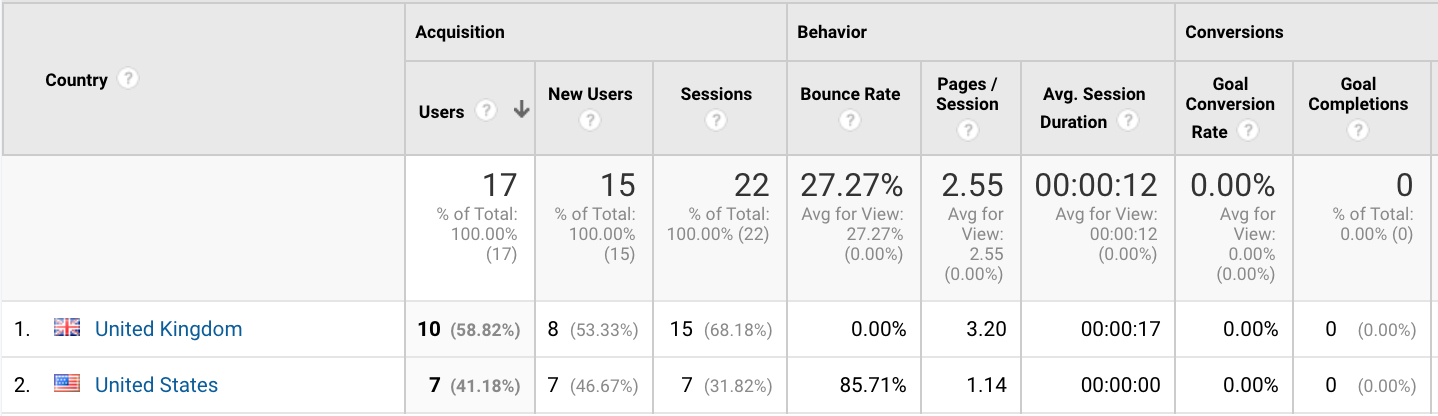
Google Analytics also breaks down where our site users are based. Nearly 60% from the UK and just over 40% from the US, we believe this is because a lot of the makeup brands Holly uses are American and we were tagging them in the posts, therefore bringing American traffic.
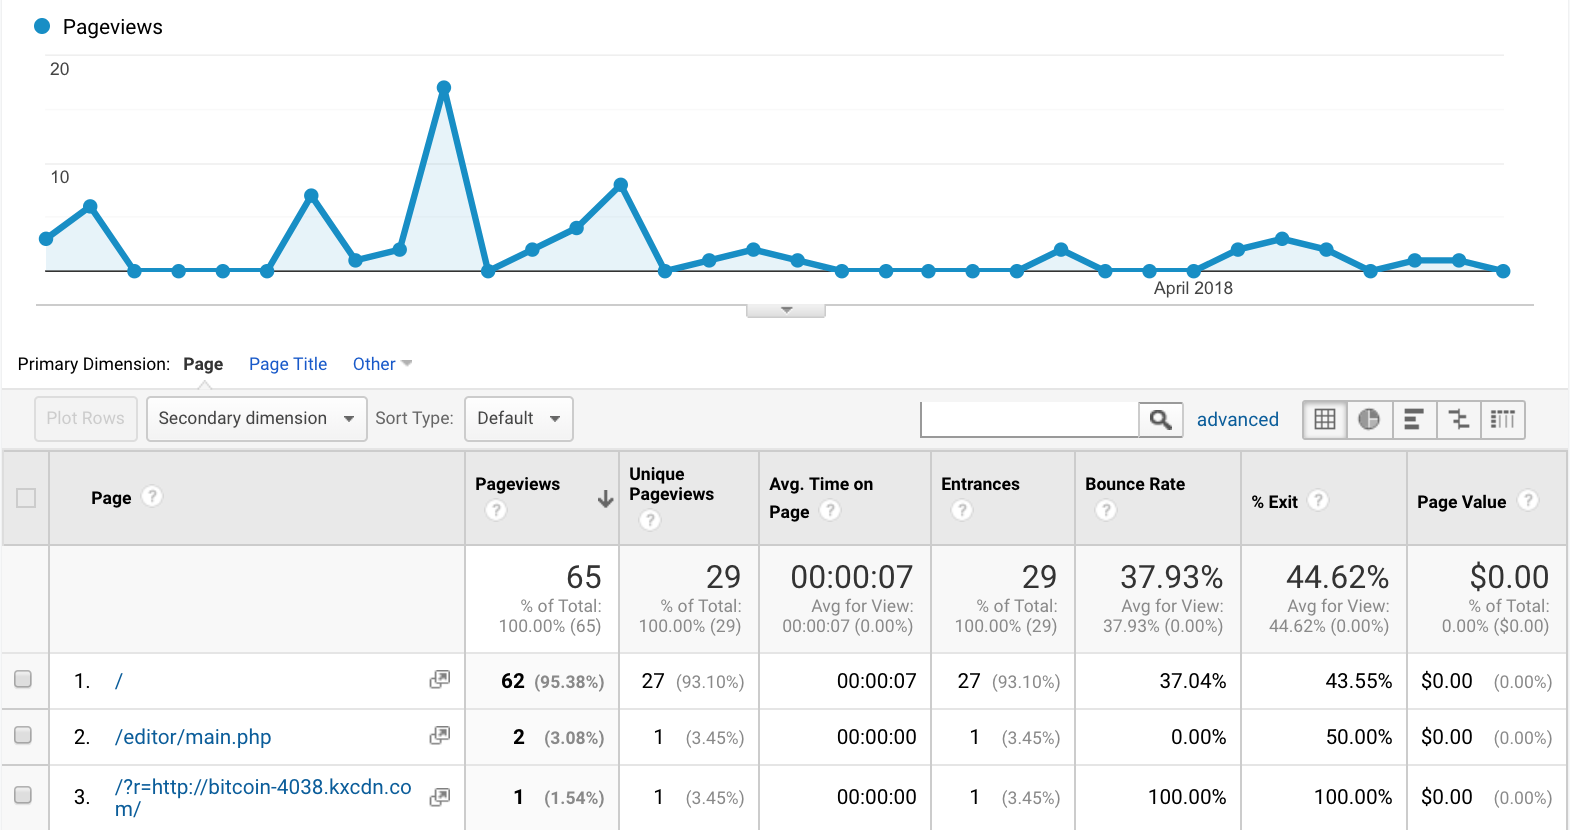
Overall Hollys page views went from 3 to 65, spiking at 17 views on March 15th, the same time we posted the links to each social media page. This is very successful bearing in mind we didn’t promote it, only had it available through bios. It didn’t give us as much of an insight of what page it came from as we wanted but it has told us Instagram is responsible for the most traffic.